I’ve made an Excel template for filling out T accounts. For you non-accounting folks, a T account is a method to trace accounting transactions through the accounts on the general ledger. Hey, wake up! This post isn’t finished yet!
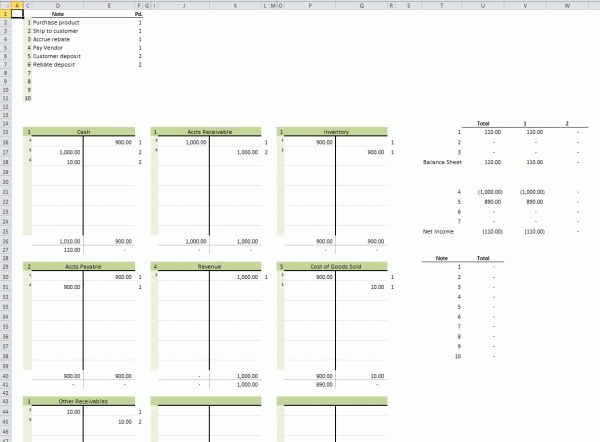
I’ve made a T account template at least three times in my Excel career. They never work out. They never make it easier than pencil-to-paper or marker-to-whiteboard. It doesn’t seem to stop me from trying, though, and now I’m making my latest attempt available to you. First, let’s look at this huge image (click to embiggen).
The top left section (C2:F11) is where you write a brief description for up to 10 transactions. Column C is the transaction number and can’t be edited. Column D is where you type the brief description. Column E is overflow for column D because I hate merged cells. Column F is the general ledger period. You can put them all in the same GL Period if it’s not applicable to your transactions. You don’t have to use this section. That is, you can leave off the descriptions and the periods, but good luck trying to figure out what you were thinking.
In this example, the transactions are listed in the order they will happen over time. This series of transactions represent a sale where we get a kickback from the vendor and we’re passing that savings on to the customer. First, we buy the inventory from the vendor. Next, we ship it to the our customer. At that point we need to make our costs correct by accruing the rebate we’re entitled to from the vendor. We pay the vendor, get paid by the customer, and finally get our rebate from the Vendor.
The main section of the workbook is a 3×3 grid of T accounts. This is where the magic happens. The top left cell of each T account is a financials statement classification number. It’s a data validation dropdown containing the numbers 1-7.
- Assets
- Liabilities
- Equity
- Sales
- Cost of Goods Sold
- Expenses
- Other Income and Expenses
That financial statement classification number is replicated down the hidden column B (and H and N) for formula purposes.
To the right of the financial statement classification number is the (merged) cell where you type the account name. The account name is only for your reference and has no bearing on any formulas in the model.
The lighter green section down the left side of the T account is a series of data validation dropdowns that allow you to select the transaction number. The main white area of the T account that’s divided vertically is the area where you record your debits and credits. At the bottom of the T account, the debits and credits are summed up and the net debit or credit is displayed.
There are two other areas to the right of the T accounts grid. The top area shows the effects on the major sections of your balance sheet and income statement. It expands to the right for however many periods you have. The financial statement classification number at the top left of the T account determines where your transaction ends up in this area. And, obviously, the period you identify in the transactions section determine the column.
The bottom area is a list of the 10 transactions and the net debit or credit by transaction. If any of these are not zero, you’re missing a piece of the transaction.
Please leave your thoughts and suggestions in the comments.
![]() You can download TAccounts.zip
You can download TAccounts.zip


